Cost distances are one way of modeling movement through space and visualizing the expenses such as travel time, money, environmental, and social impact that one will encounter along the path of travel. This form of analysis is useful in decision-making to find the most efficient or effective route for utilities or couriers.
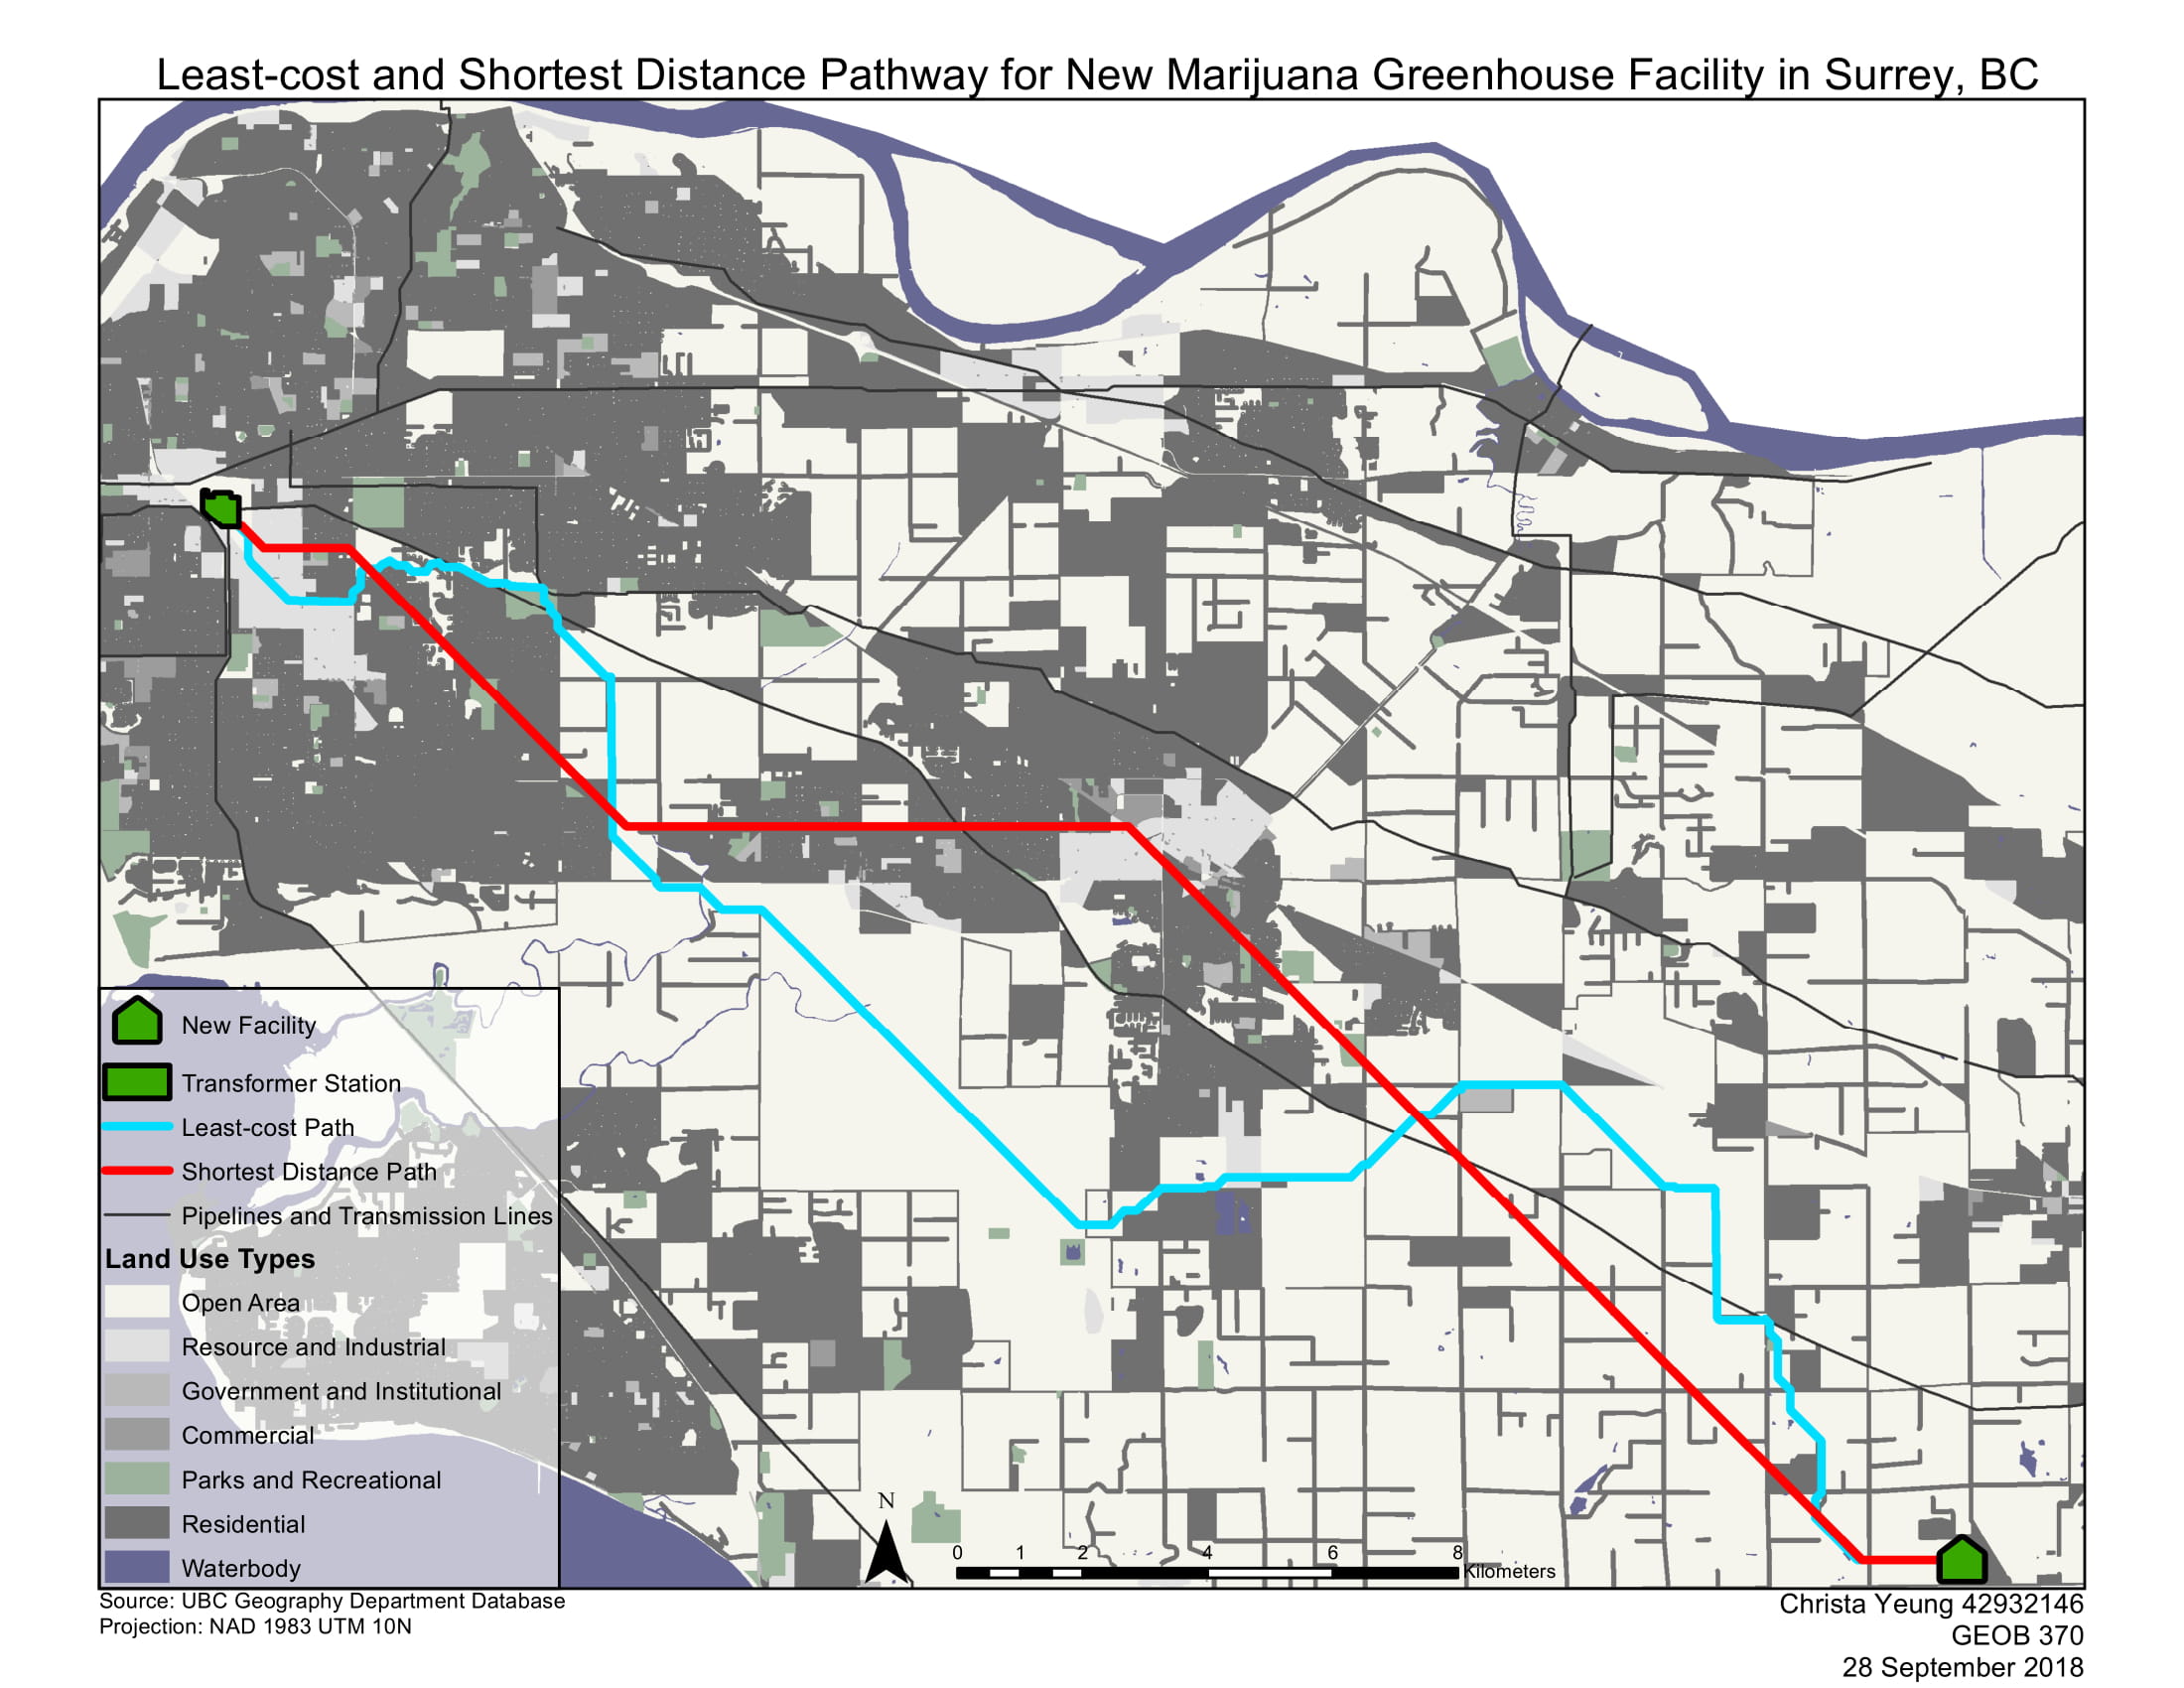
In this assignment, we were tasked with finding the least-cost path for a transmission line from an existing high voltage transformer station to a marijuana greenhouse facility.
What is a Least-Cost Path?
The jagged least-cost path route shows the most cost-efficient path for the new transmission line from source to destination according to the land use barriers that it must travel through. Each type of land use (ex. Open area or residential) has an assigned “friction”, meaning a relative social or monetary value that makes movement through it more difficult. For example, we would want to avoid constructing the line through a residential area as it has both physical barriers, higher monetary costs, and may receive complaints from residents. In comparison, an open space has no apparent frictions and allows for easier line construction.
This is different than the shortest-path route (Euclidean route) which shows the shortest length for the transmission line to run from source to destination in meters. This path does not factor in the frictions of land use and is essentially the path “as the crow flies”.
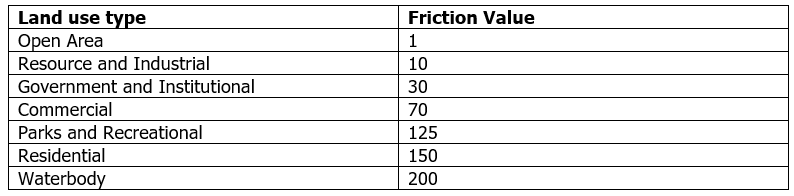
The relative land use type costs were assigned according to the above friction values.
Limitations and Improvements
A lot of factors aside from the assigned land use type poses major barriers to our least-cost path. For example, the current model doesn't account for schools the power line might cut through. To examine this issue, I first created a 500 m buffer around education features and identified 3 schools within 500 m of the current least-cost path route, and 58 schools within 500 m of the shortest-cost route. From here, I would assign a friction cost of <null> or a high value (ex. 1000) to education features so that they are avoided in the least-cost path calculation.
In this lab, we convert vector land use data to raster data, as such, stream features change size due to the ever relevant Modifiable Areal Unit Problem (MAUP). The MAUP is one way that uncertainty is built into digital representations of real space as the raster pixel size (25m x 25m in this case) generalizes all features within that area to one value or no value.
To overcome this problem, I would create a buffer around the stream to mitigate the potential impacts of the transmission line on the stream and the surrounding areas. Another method would be to reduce the cell size when I convert the data from vector to raster as a way to retain more data and have a more precise understanding of the size of the river. Then, the river would need to have an assigned a friction value to it. Both methods would establish that, during least-cost analysis, the stream exists, has a friction value, and should be avoided.
HERE ARE SOME SKILLS I PICKED UP IN SUMMARY
- Created an address locator to geocode Langley roads for least-cost path analysis use.
- Performed a raster least-cost path and shortest-path route analysis for energy supply to a new marijuana greenhouse using City of Langley land use data.