Over the last two weeks of my GEOB 270 Introduction to Geographic Information Sciences, I worked on a final project with my three classmates Ahmed, Christina, and Jacqueline to do an analysis of gentrification risk in the City of Vancouver.
Gentrification is a process of urban regeneration involving demographic and economic changes that upgrade low-income neighbourhoods for uses that yield higher capital investment. This process displaces many of the original residents and occurs inequitably across contours of class and race difference. As such, our study will be useful to bring attention to neighbourhoods and residents that face these risks.
Project Methods
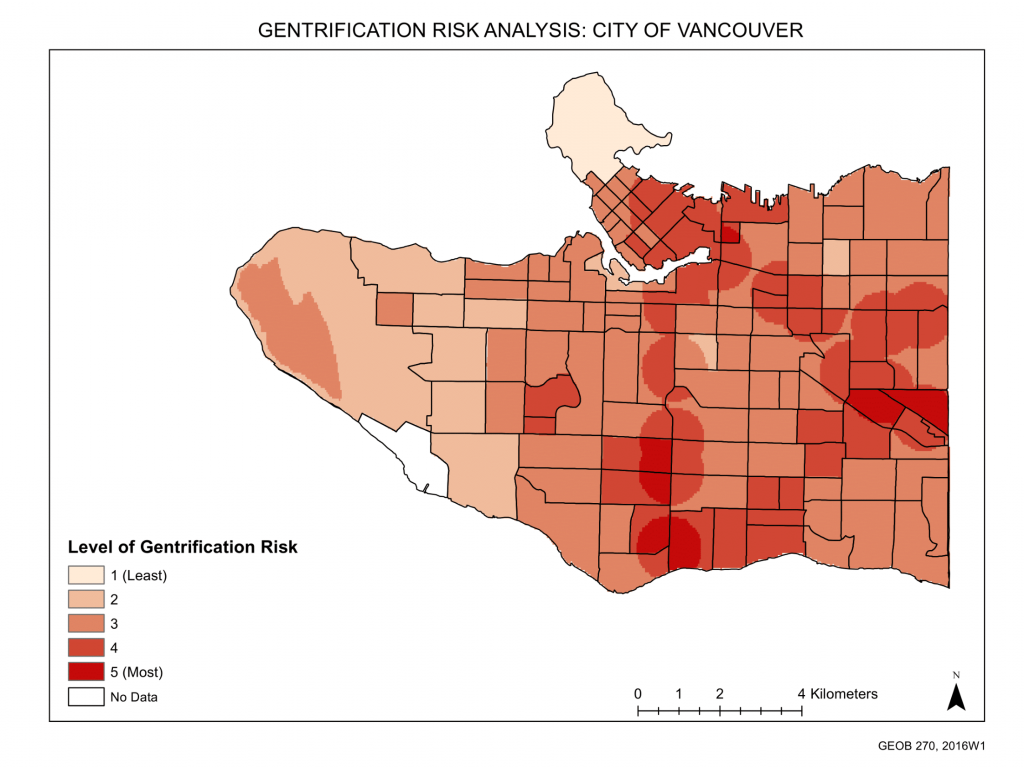
To measure neighbourhoods that are at risk of gentrification, we examined previous literature on factors that lead to gentrification in Vancouver. These factors include transit and transit development areas, immigrant populations, and populations that spend greater than 30% of their total income on shelter costs to measure susceptibility. Our study uses data from the Metro Vancouver and City of Vancouver Open Databases and the 2011 National Household Survey and uses Multi-Criteria Evaluation (as seen in the above map) to weigh factors and their influence to gentrification. Through the Multi-Criteria Evaluation, one can see where all three factors overlapped in certain census tract divisions to rate the risk of gentrification on a scale of 1 (lowest) to 5 (highest).
Project Management
All four of us participated in the research, project proposal, data acquisition, map making, and analysis of our areas. To ensure organization, we kept a group calendar to decide on due dates for each stage of the project and regularly updated a spreadsheet of the data we downloaded and edited. This was a valuable experience compared to the individual GIS assignments we worked on throughout the term and after coming across issues of saving layers into different computer drives, geodatabases, and USBs, I think we have all learned a bit more about the importance of organization. Thank you to Microsoft OneDrive and the almighty Cloud (technology is great)! And most of all, thank you, team! :)
Project Results
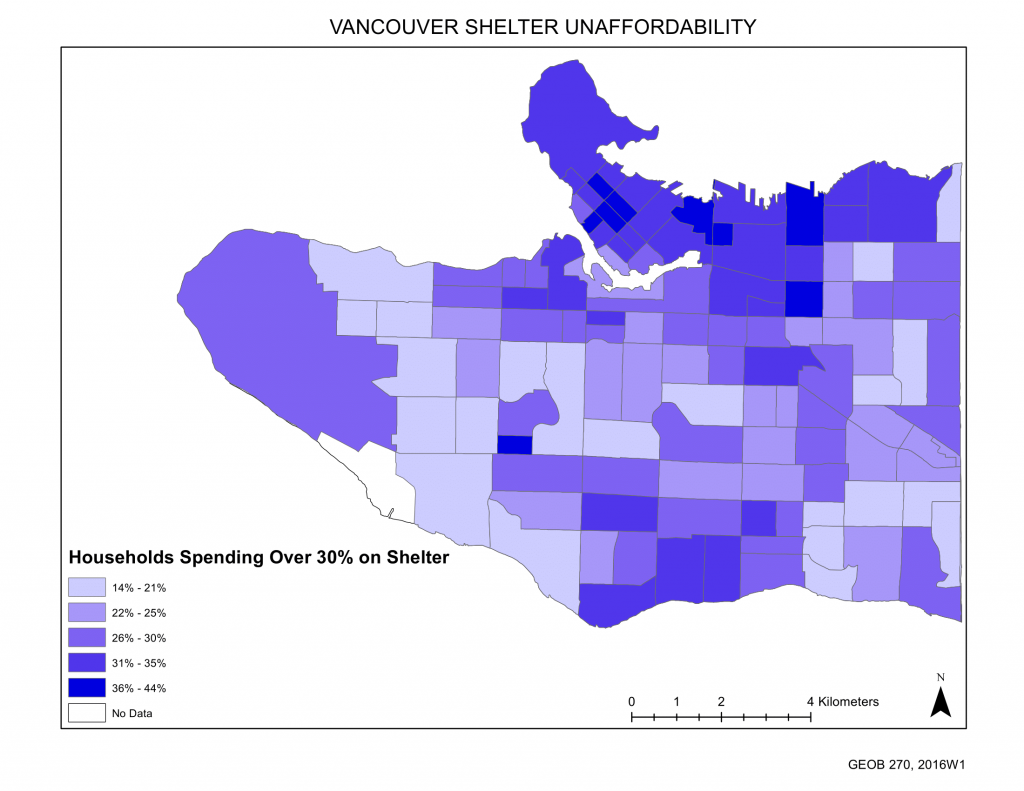
Housing Unaffordability
As many studies cited low-income housing areas as high-risk, we weighed housing unaffordability as our highest risk factor for gentrification. Adam Smith, a scholar on gentrification, argues that the idea of a "rent gap", where a difference between the costs of monthly rent and the land's market value exists, encourages landowners to sell these mostly aging rental units for redevelopment that will result in a higher return of capital. Unaffordability here is defined through the Canada Mortgage and Housing Corporation's criteria of households that spend over 30% of their income on shelter.
In the above map, we see that areas such as the Southwest Marine Corridor fall quite low on the unaffordability scale. These areas, though dotted with expensive, new stock housing, are populated with some of the wealthier residents of Vancouver who are owners rather than renters. When using census data, it is important to normalize and present your information as ratios rather than just numbers of unaffordabilty in households. As such, the above map shows the number of houses spending over 30% of income on shelter over the total number of households.
![]()
Rapid Transit Development
Developments that are within walking distance to a train station (measured by 5- and 10- minute walk buffers), are highly marketable and increase surrounding land demand and value. Transit-oriented developments (TODs) are also mapped above as these are special areas that have been zoned to promote density and access to public transit. The location of TODs are often chosen to be in areas with aging buildings and low-income residents to face minimal resistance against demolition. Rapid Transit Development has such been explored in an article on gentrification in Burnaby by Craig Jones and David Ley who state, “there are no incentives to preserve or repair aging affordable units, especially when a TOD-inspired neighbourhood plan offers more dwelling units, profit to the developer, a density bonus for the City’s coffers, public amenity enhancement, and all of the environmental gains that have made TOD such an irresistible tool”.
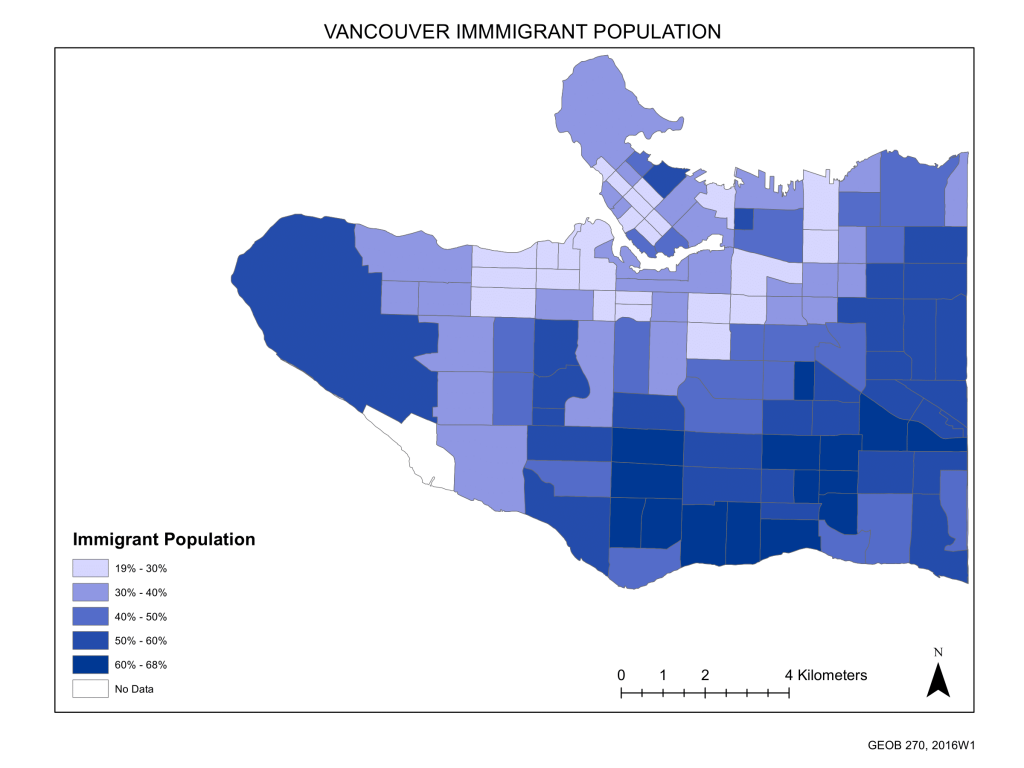
Immigrant Population
Here is the map I created! Where there is high housing unaffordability and high immigrant population this may be indicative that immigrants of limited resources are living in aging rental housing that is susceptible to redevelopment. In the example of Marpole, which includes “over 4,000 units of relatively affordable market rental housing” but 85% was built prior to 1975, it is likely that, in a housing climate of increasing demand, landowners are more likely to wait to outprice the renters and sell the property to developers for a higher yield than invest in maintenance of current affordable housing.
A lot of my research and projects have been focused on gentrification in Chinatown this term, which led me to find that diversity of immigrant neighbourhoods has also been identified as attractive to gentrification. This has been seen in Chinatown which is of 60%-68% immigrant population, high on the gentrification risk scale, and already has condo developments, a renewed nightlife scene, and neighbourhood changes commonly identified in gentrification trends. Cultural diversity has a tourist value and attracts young professionals of the creative and service sector to invest in the neighbourhood.
Error and Uncertainty
Here are some of the uncertainties we came across during our project:
1. Census data is outdated (from 2011) and there have been major housing and demographic changes since.
2. Difficulty in confirming aggregate trends due to lack of statistical evidence on the City of Vancouver in particular.
3. Additional barriers due to immigrant identity as visible minority or refugee status.
4. The walk radius is speculative: People will not necessarily opt to drive over taking and buffer shape as circular does not match real walking patterns.
Conclusion
This project has been an important learning experience for me as I have combined tools of past assignments to:
- Acquired governmental shapefile and database file (dbf) data from the Metro Vancouver and the Canadian Census 2011 to map city developments and demographics by census tract in the City of Vancouver.
- Performed a Multi-Criteria Evaluation with ArcGIS using housing affordability, rapid transit development and immigration population to map factors of gentrification risk.
- Researched and wrote an analysis of gentrification risk GIS project with three group members to highlight findings, uncertainties, and future suggestions for research.
Update- March 13, 2017
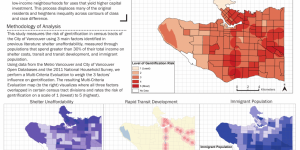
Since finishing the course, I have found how valuable these projects were to encourage me to think about career interests and make connections to other courses I am taking. As such, I have created a simple infographic that summarizes this project. The graphic was intended for a visual portfolio I submitted to apply for the UBC Bachelors of Environmental Design Program in February.
