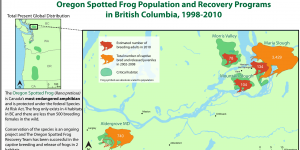
For the final project of my GEOB 372- Introduction to Cartography course, we were tasked to make a thematic map on any issue we were interested in over the course of 3 weeks. As a volunteer for educational programs at the Vancouver Aquarium I decided to use my cartography skills to make an educational proportional symbol map that would summarize the current state of Oregon Spotted Frog populations and recovery programs in BC from 1998-2010. The result, as you can see above, was a very informative map that combines graphs, maps and a brief context section.
This experience was quite fun as I got to build onto the Oregon Spotted Frog Rescue Team's data to share their mission and work!
Why Frogs?
Amphibians are currently facing rapid mass extinction worldwide! Frogs like the Oregon spotted frog face various challenges such as water pollution, invasive species, habitat loss by land use change (construction, agriculture, highways), and climate change. The Oregon spotted frog is the most endangered amphibian in Canada and is listed as critically endangered under the federal Species at Risk Act. A recovery strategy and team was adopted by the province in 2012 and has been captive breeding, recording populations, and monitoring frog occupied sites. Through this map, I wanted to show how recovery strategies of breeding and reintroducing the frogs have been effective to prevent extirpation of the species.
Update July 8, 2018:
The Vancouver Aquarium has recently raised and released 1000 Oregon spotted frogs in BC! Here is a video on their recovery efforts if you're interested in learning more :)
The Map
- Purpose: To show how recovery strategies of breeding and reintroducing frogs has been effective in preventing the extirpation of the Oregon spotted frog.
- Audience: For researchers and conservationists like the Oregon Spotted Frog Recovery Team and Vancouver Aquarium to educate people aged high school and up on the plight of amphibian extinction and efforts to save the species.
As always, having a clear audience is key to clearer visual communication in your map! With this in mind, I added features like:
- an Inset map: which provides wider geographical context to those who may not be familiar with the Lower Mainland region of BC
- Frog shapes: which are used to draw readers' attention to the subject of the map. I employ different colours, proportional size, and opacity in a visual hierarchy to communicate information about the frog population. Consistency in the frog symbols is also used to tie together the map with corresponding graphs.
- Graphs: which show a bar graph of the population from the open dataset published by the Government of Canada. Frog symbols and habitat shapes are incorporated to tie the map to the graphs.
Timeline of Progress
Week 1:
- Idea brainstorming.
- Contacting the Vancouver Aquarium about possible topics that I could help them make maps for.
- Research on the history of Oregon spotted frogs and initial data collection through various online and government sources.
Week 2:
- Data acquisition from the BC Government's OpenData site and written reports.
- Calculating proportional symbol sizes with statistical reports in Microsoft Excel
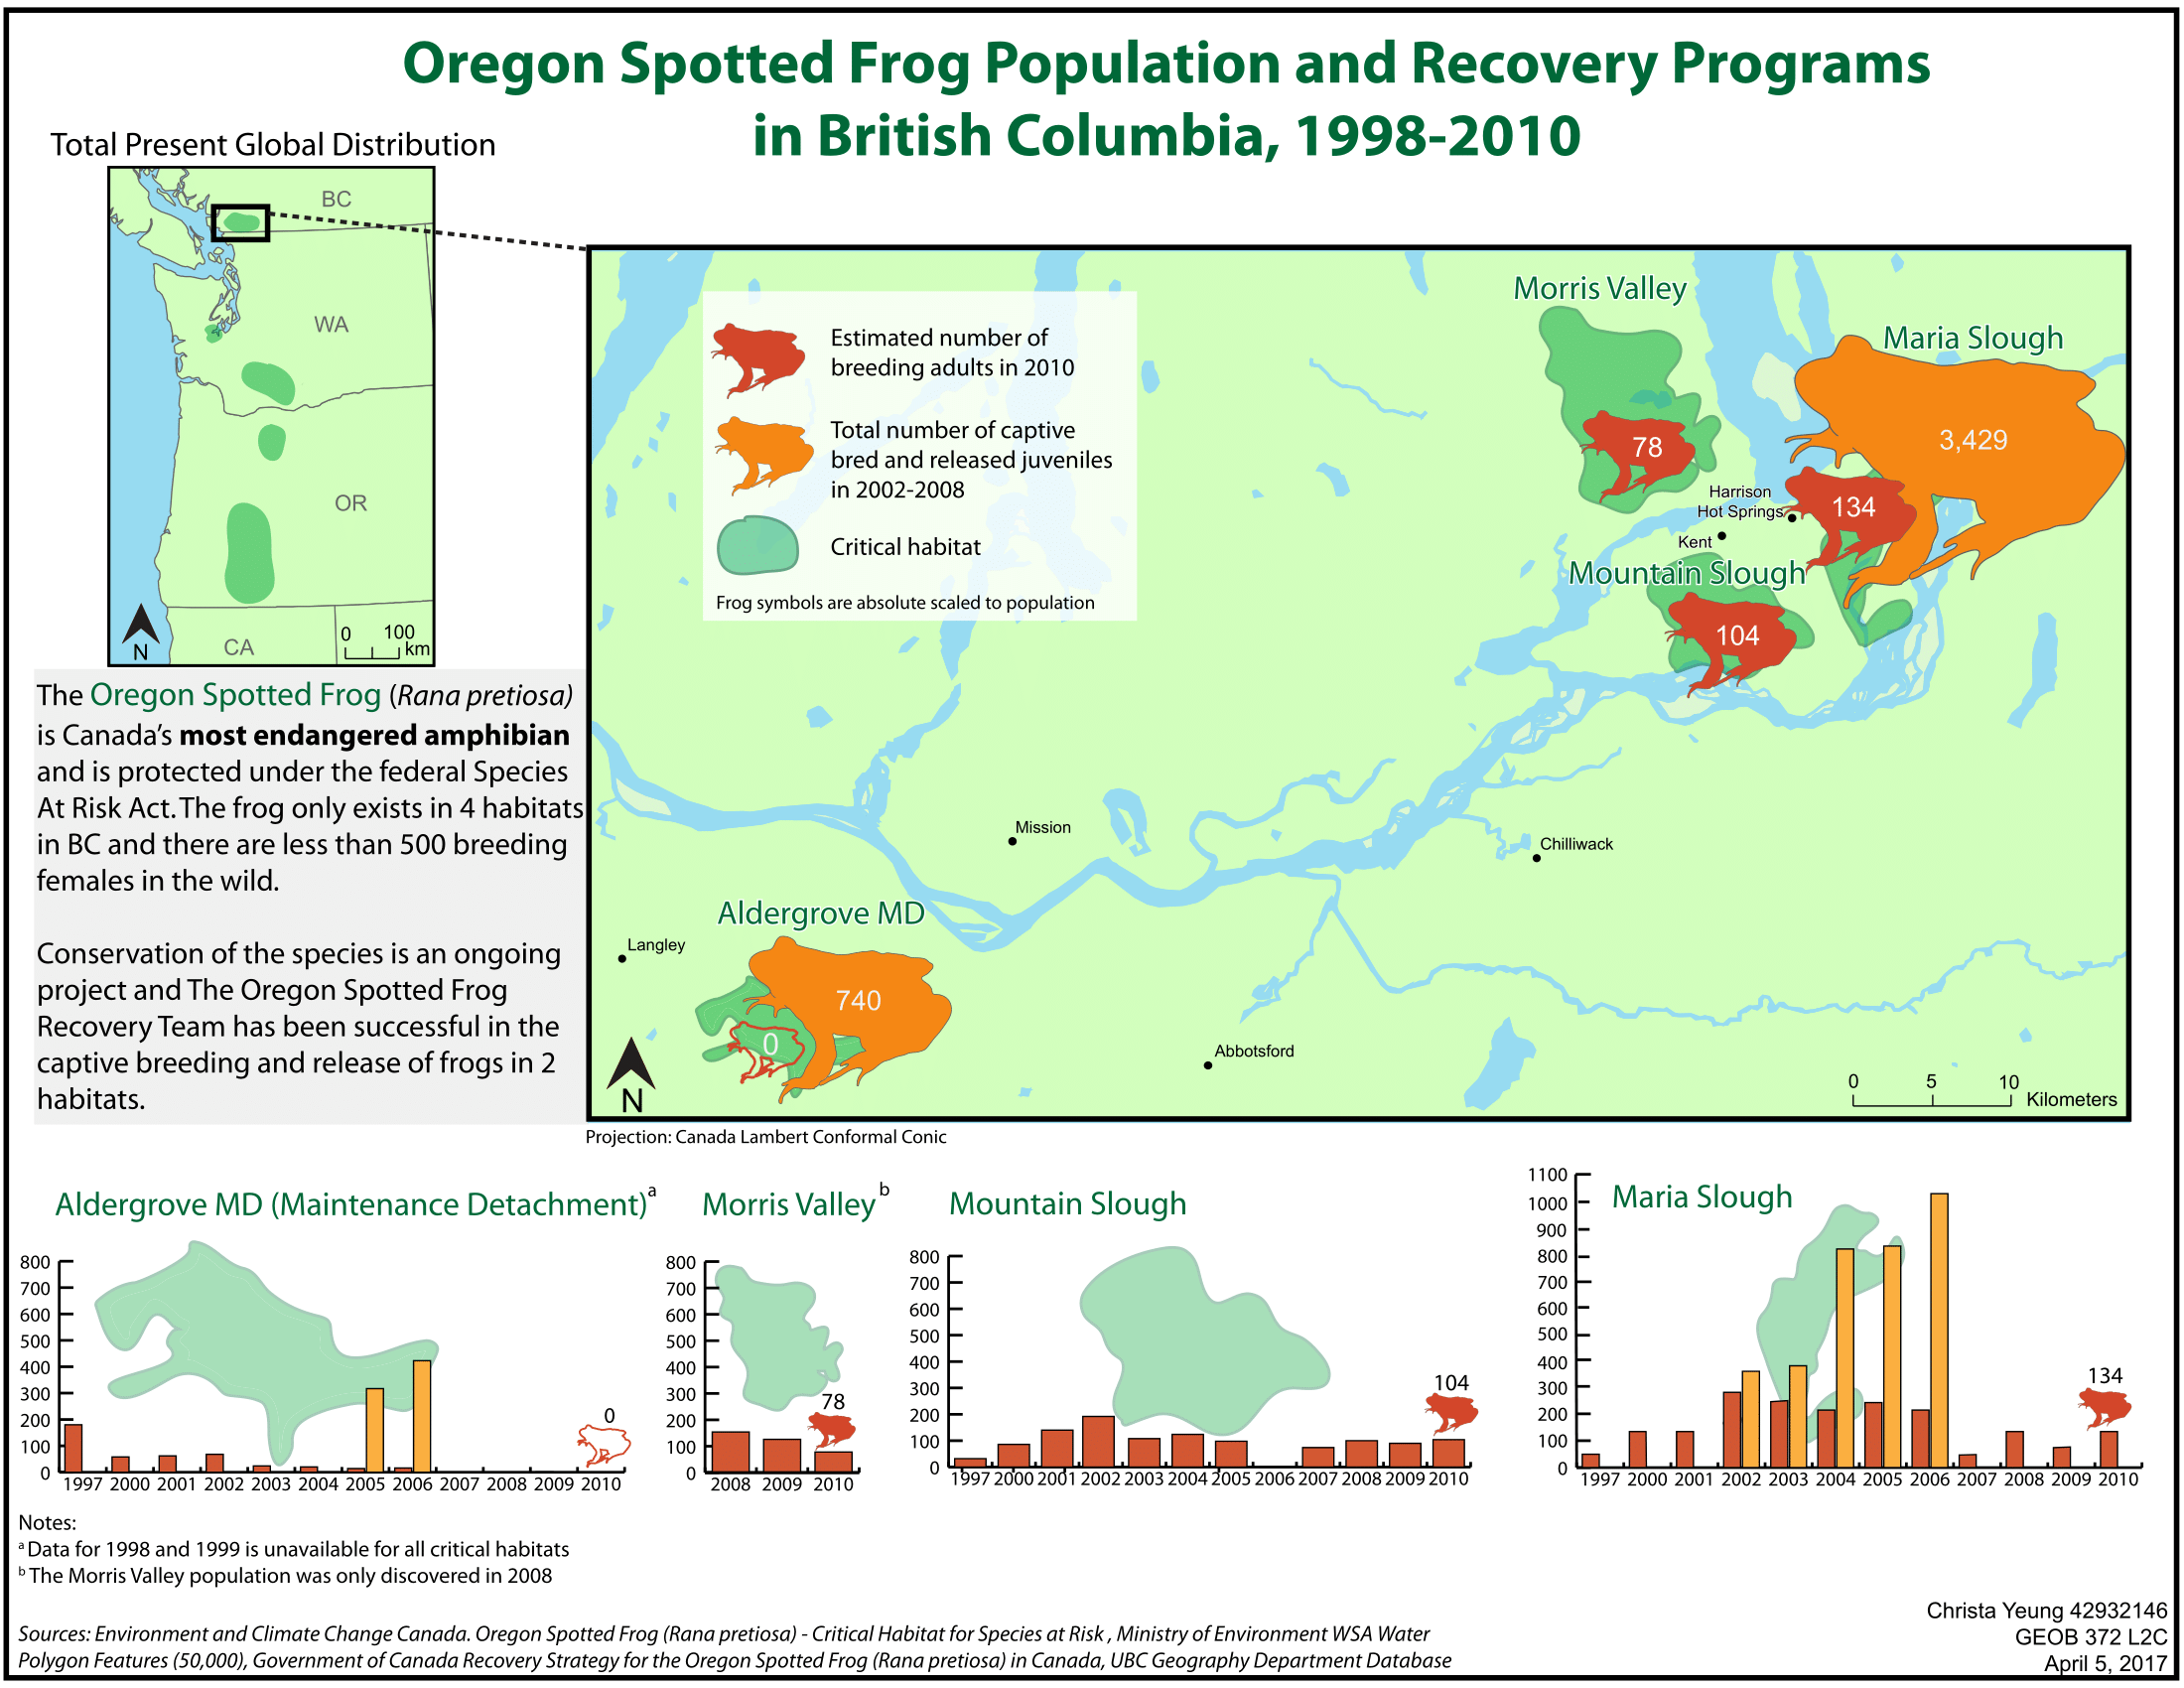
- Exporting shapefiles from ArcMap into Adobe Illustrator.
- Cleaning up shapefiles and generalizing line-art.
- Drawing frog symbols and organizing basic map elements
- Draft 1 is complete!
Week 3:
- Designing the rest of the habitat graphs.
- Draft 2 is complete!
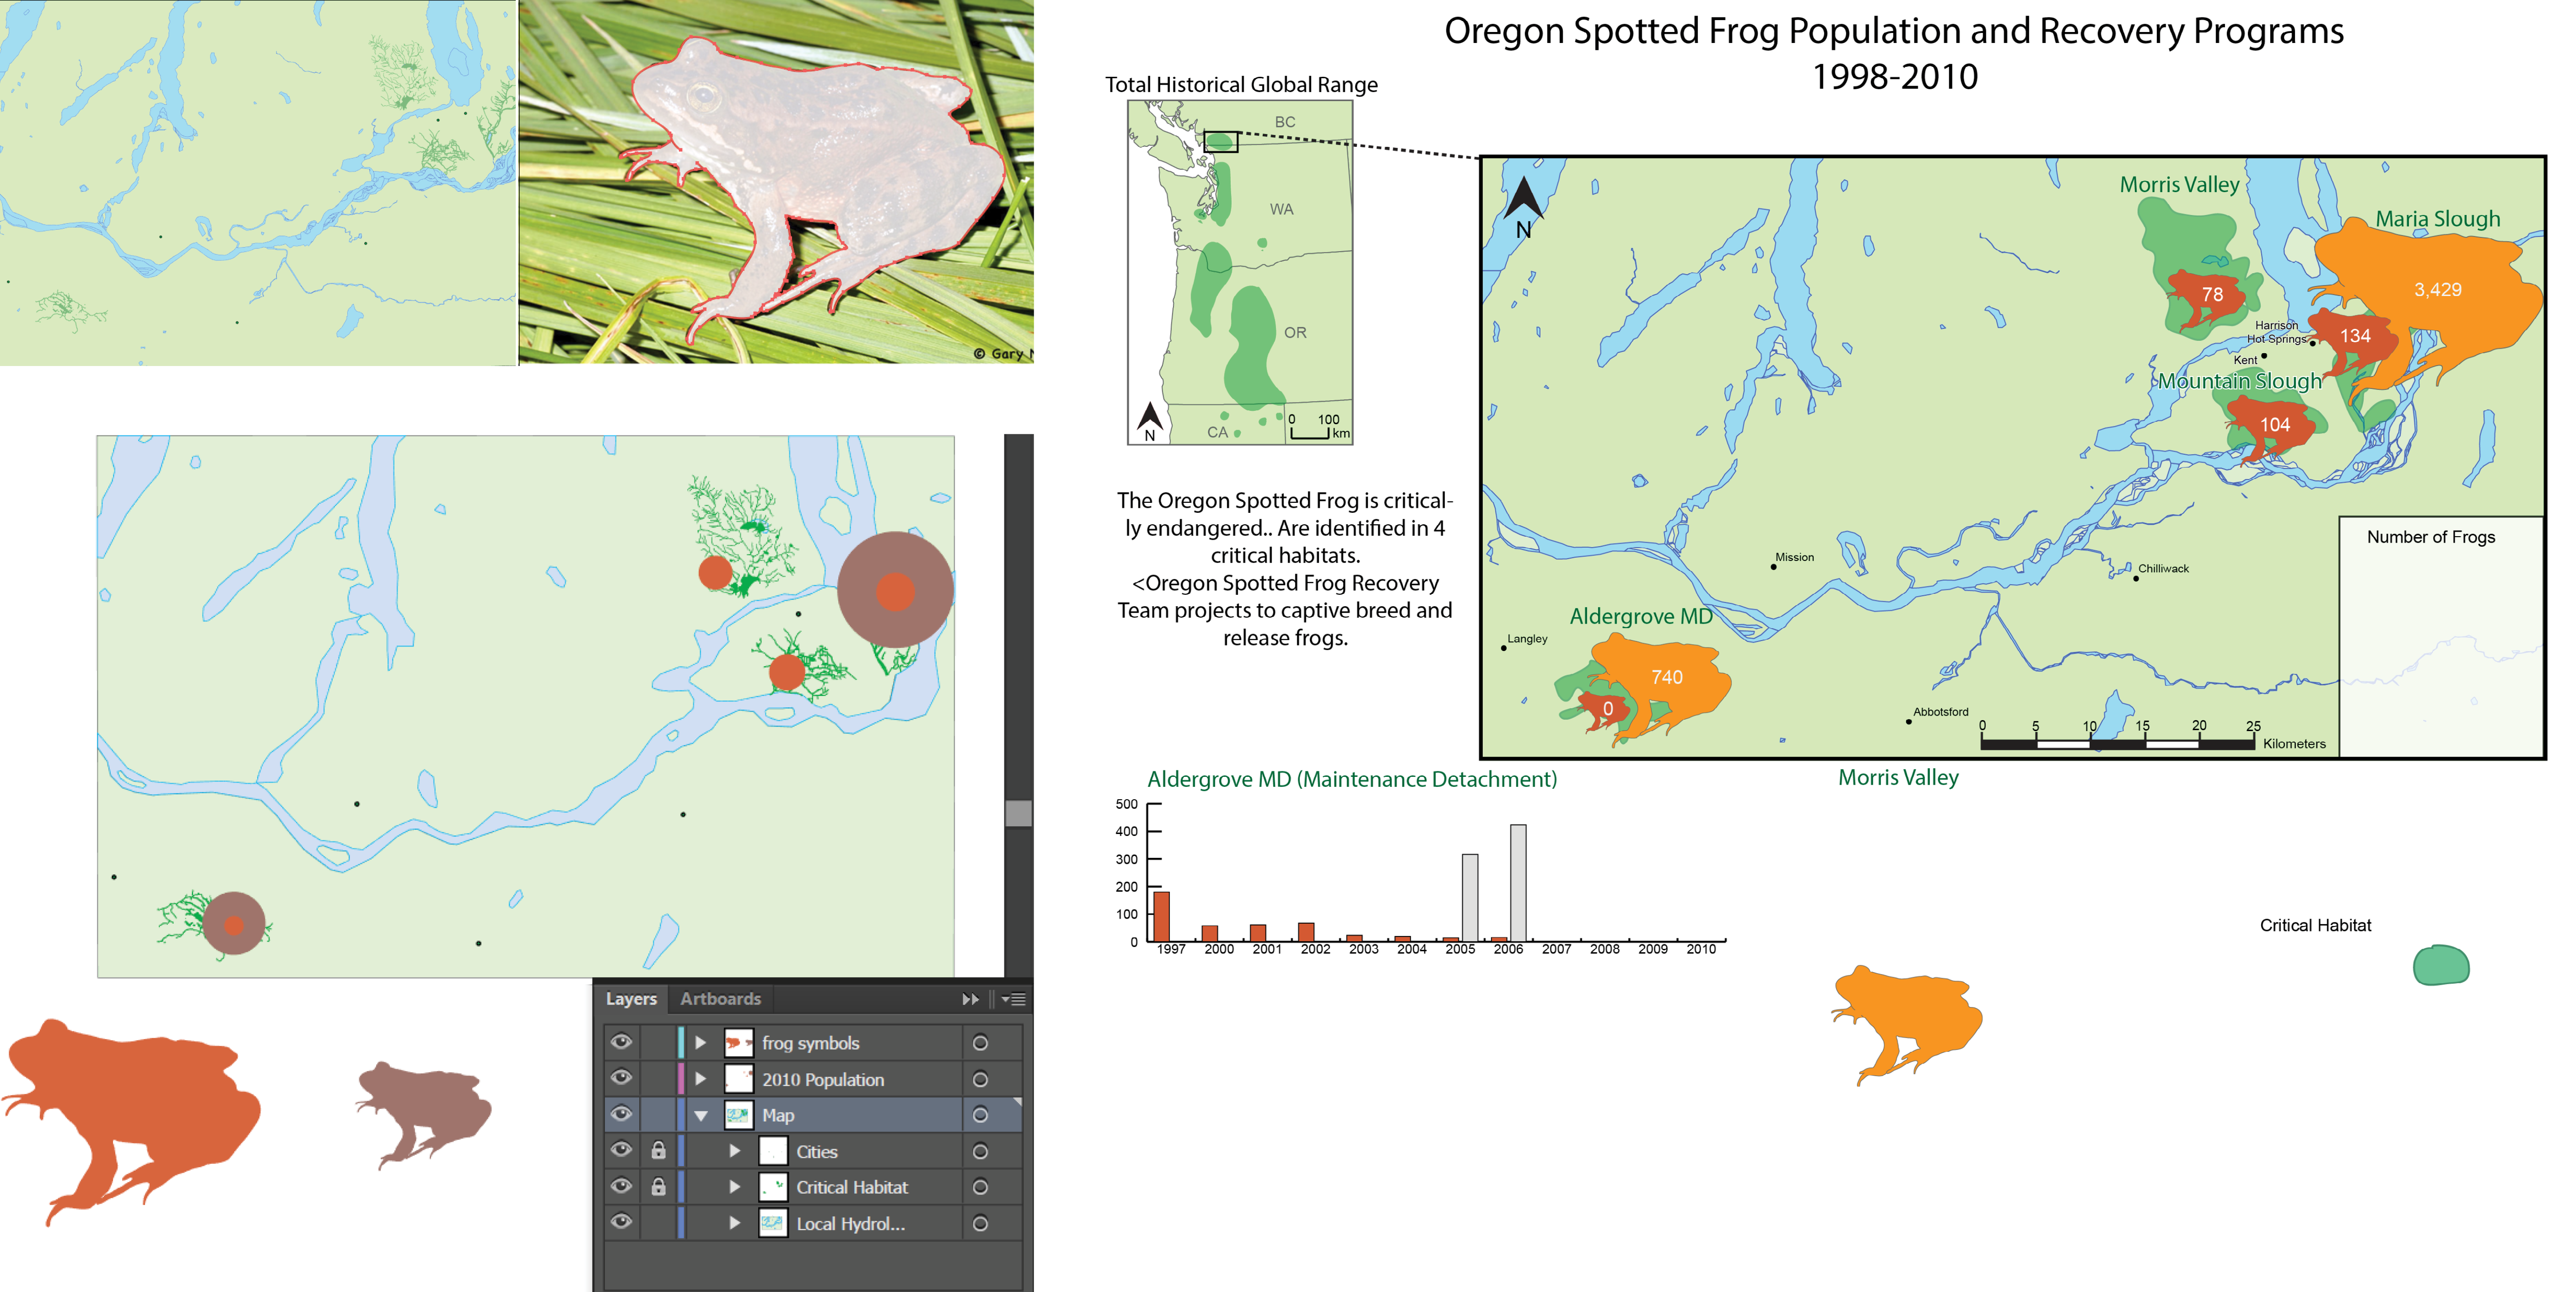
- Peer reviewing maps in class to gather feedback on map design and effectiveness of visual communication.
- Updating fonts, line-art thickness and colour, and graphs based on feedback.
- A final map is produced! (See top image)
Ideas for Future Development
This project allowed me to combine all the lessons I had learned in past assignments about effective visual communication and mapping techniques with my passion for native animal conservation! However, the journey is never over and in the future, I would like to:
- Update the map as new data is published to visualize the changes in population.
- Contact the Vancouver Aquarium or Oregon spotted frog recovery team again so my map can be used for educational/informational purposes.
HERE ARE SOME SKILLS I PICKED UP IN SUMMARY:
- Designed a proportional symbol map of Oregon spotted frog populations and recovery programs in BC from 1998-2010 using Adobe Illustrator and ArcMap.
- Acquired governmental shapefile and statistical data from the BC Government to map habitats and population number change of the critically endangered Oregon spotted frog species.